


Stamford Property Tax Re-valuation 2022
The city I live in decided to perform re-valuations for all properties to generate new assessments for property taxes. The average change in assessment was 18% across all properties in the city. However, there was a lot of variation. For example, together with a friend of mine who works in GIS, I scraped publicly available data and we plotted the average assessment change across sections of the city. We saw a general trend that properties closer to downtown had a greater increase in their assessment, but there were also local differences within this broader trend. My home’s assessment went up 33%, which was almost double the city average!
So to see if my taxes were raised fairly compared to other properties in the city, I built a XGBoost regression model to estimate what my taxes “should’ be compared to everyone else. In addition to scraping assessment and location data, I also pulled various features (e.g. square footage, year sold, etc) and use these in the model. I found that the previous assessment and the latitude (consistent with data visualization) were the top two features in the model. Furthermore, the model predicts my assessment should have only increase by 30%, not 33%!
The cross-validated model outputs for every single family home in Stamford can be found here: https://docs.google.com/spreadsheets/d/1B9p15_Xuwv2HuCPYKVdWTHQVXqmHckQ-fAg_xgNnVrU/edit?usp=sharing
Recurrent Neural Network model of state-dependent neural responses to optogenetic stimulation
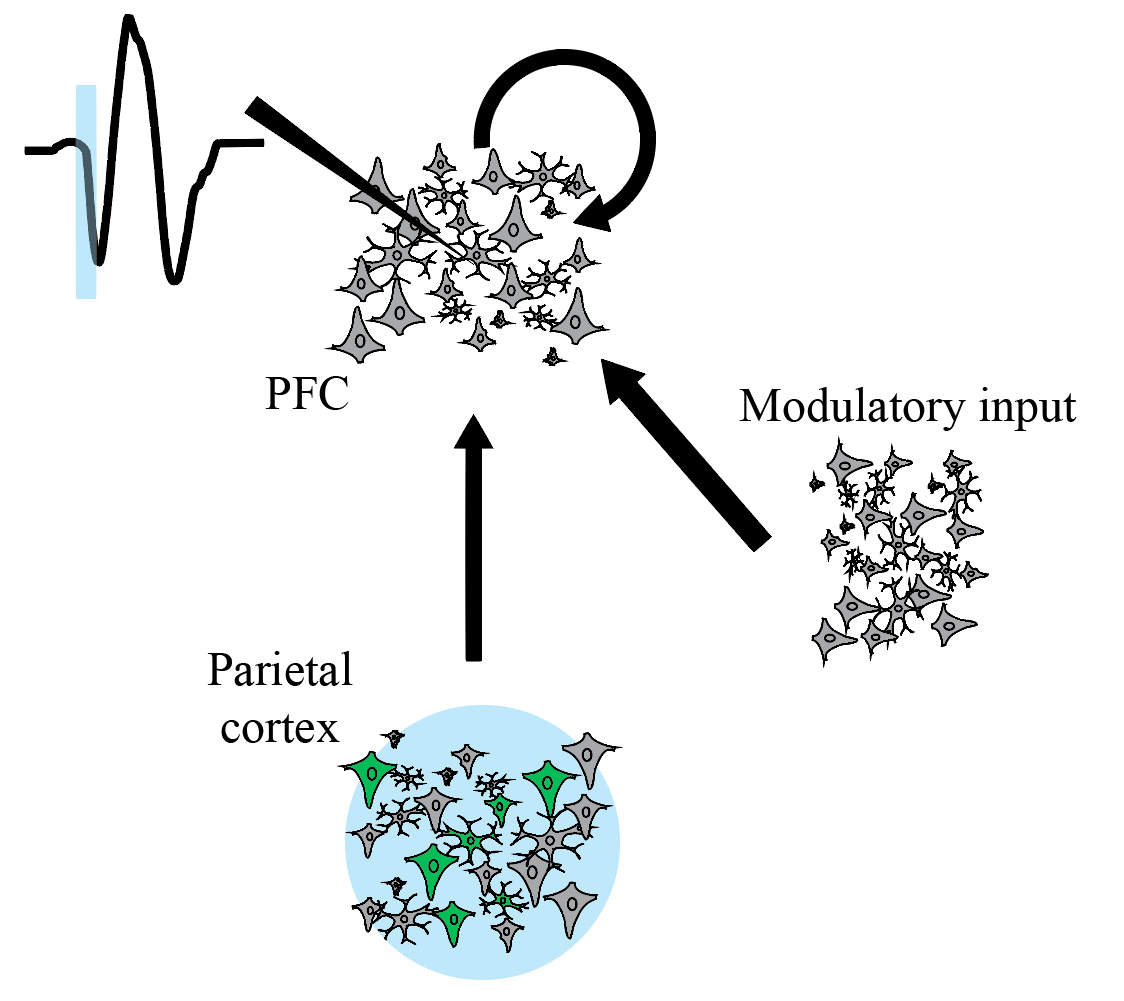
In the lab, I performed experiments in which I optogenetically stimulated parietal cortex while measuring synpatically-driven responses in frontal cortex. I found that the responses to stimulation varied with behavioral state—responses showed more oscillatory behavior when the subject was engaged in a delayed movement task. What are potential network-level mechanisms that might drive this state-dependence of the response?
I hypothesized that one such mechanism might be an additional modulatory input from a third (unknown) area which alters that sensitivity of the PFC neurons and generates for ringing in the impulse response. Unfortunately, we did not record data from this area. So, to test this hypothesis I set out to see if an RNN could exhibit state dependent responses given a modulatory input.
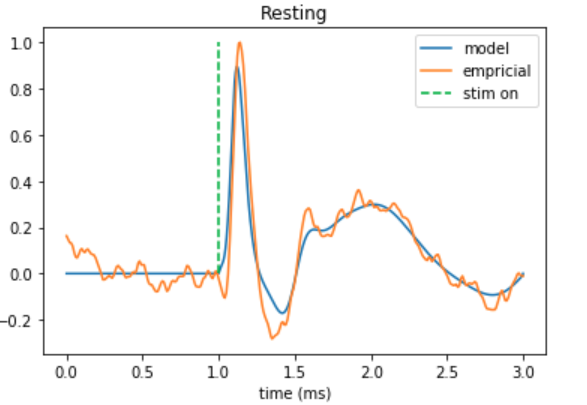
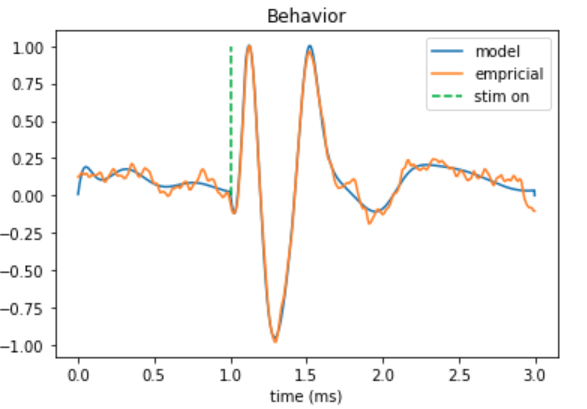
I trained the RNN using FORCE learning (Sussillo & Abbott 2009) . Importantly, I trained one RNN (with the same weights) for both conditions. I found that the network was able to generate state-dependent responses. My next step is to explore the properties of the artificial PFC network and see how the modulatory input affects excitability and functional connectivity across the individual units.

Tracking Squash Players
As an avid squash player, I am interested in doing some analysis on my own game as well as players at different levels. Squash is a highly tactical game. Position and movement on the court play a big role in the outcome of a point or a game. So, for the first step in analyzing squash games I set up a video processing pipeline that allows me to track the position of the players. Using OpenCV, I implemented a neural network trained to detect people and combined this with an object tracking algorithm to automatically measure player movement.
The two images above are from a video of two professional squash players, James Willstrop and Saurav Ghosal (https://www.youtube.com/watch?v=ax-oU67n_gY&). The left shows an example of the tracking output. On the right is a heatmap of Willstrop’s locations during the entire video. The green strip that runs from the left service box down to the back of the court suggests that more hits are played on the left side, the backhand. This may make sense because the backhand is more about setting up a point and extending the rally, compared to forehand which has more power and may be more likely used to hit winners and end the point.


Personal Wellness
For the last few years I've been collecting my own health data on my Garmin VivoActive HR. I also have been collecting daily self-reported personal health data. I set up a Google survey to be sent to me every morning. I've been able to fill it out most days.
The time series data reveals some interesting trends. If I can predict how my day will be based on various data/activities, this may help me figure out what sorts of things to prioritize to optimize my personal health.
Here I run a random forest regression model to predict the my score for the day based on my daily activity/health data. I chose to use a decision tree model because it may help me decide what to do on any particular day to maximize the likelihood that I have a "good day" (that it scores high on my 1-10 estimation).
The most relevant data point for how good my day was was the number of steps I took. Interestingly, it was non-linear, with the best days happening in the middle range. So it seems keeping my steps to a reasonable amount each day is important. To little walking means I sat at a desk all day or binge watched Netflix, and didn't do very much. On the other hand, a lot of steps may mean a hectic day of running errands, etc. So a day with a reasonable number of steps could mean being active without being too busy.

Soft rims at Oracle Arena?
I had been watching the NBA finals (great series!) and noticed that both teams got some really friendly rolls, particularly at the GSW home court. At one point a Steph Curry 3 hit the front rim, bounced up to almost the top of the backboard, came down and rattled off the back rim and through the hoop. So I started to get suspicious. Does Oracle Arena have soft rims that may preferentially benefit the Warriors game?
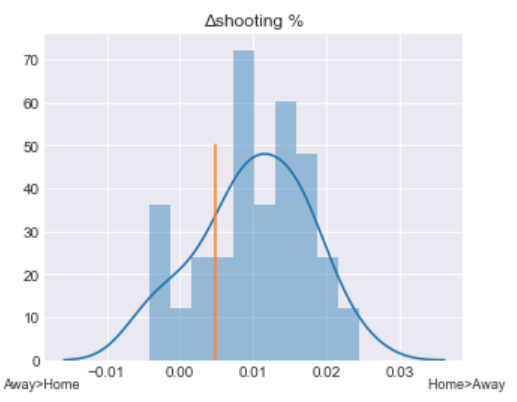
Both histograms show that most of the shooting percentages differentials are greater than zero--teams shoot better at home than away. However, the home/away difference in overall shooting is smaller for team playing at Oracle Arena than at most other arenas. This might be slight evidence that the rims are softer. But, when it comes to three point shooting, the home court advantage is greater when compared with Oracle than most other arenas. So Oracle may be a tougher place to shoot 3s.
A rank-sum test showed that there is no statistically significant advantage for shots at Oracle Arena. Therefore, I found no evidence that the rims at Oracle arena are more friendly than any other arena. This isn't a huge suprise--its likely that the NBA checks rim specs at certain times during the season.
I guess the Splash Brothers are just really that good at throwing basketballs through a hoop!